Riverine Nutrient Inputs
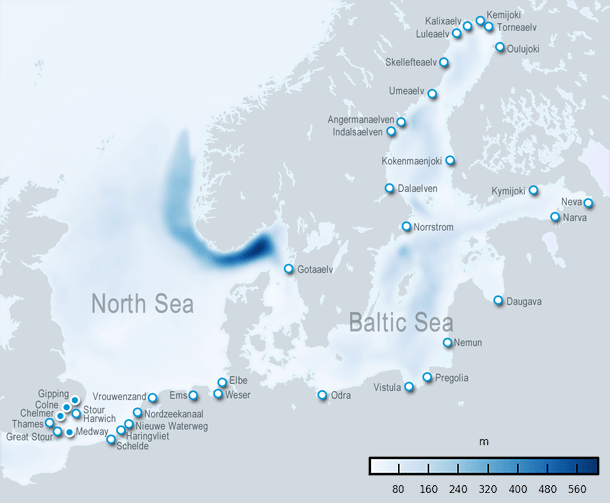
Eutrophication in coastal waters basically reflects altered nutrient inputs. A realistic eutrophication-reconstruction requires therefore data about riverine inputs of nutrients. The here presented data basis for the North Sea and Baltic Sea is based on the integration and updating of long-term measurements of discharge data, macro-nutrients (N, P, Si) and carbon concentrations (DIC, DOC) of German, Dutch, Scandinavian and Baltic rivers.
Data sets from different sources were verified with regard to data consistency and quality. Temporal and spatial measurement gaps were extrapolated with statistical procedures and documented comprehensively, so that now a complete time series from 1977 to 2012 exists. This data basis is available as NETCDF-In component. Furthermore the governmental discharge correction factors were incorporated in a second NETCDF-In component so that discharge values at the river mouth (=data input for models), additionally to the taken measurement data at the last tide-free gauge, are available.
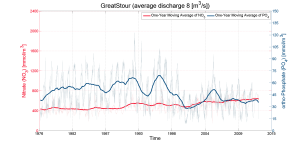
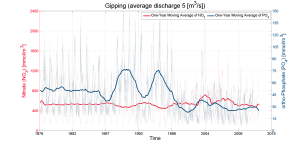
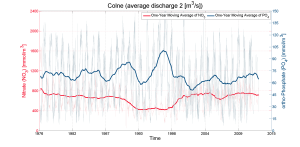
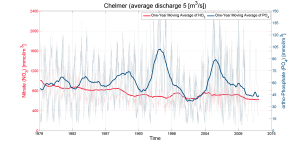
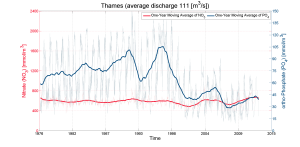
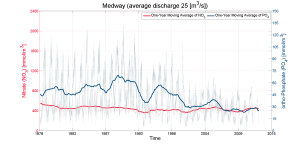
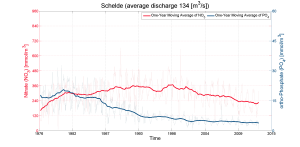
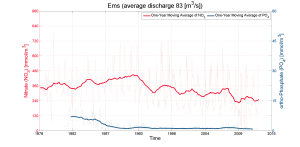
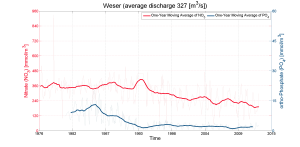
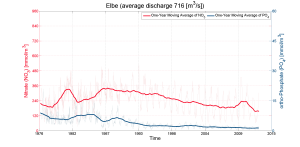
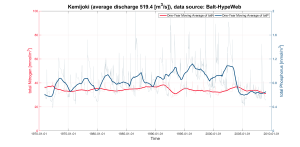
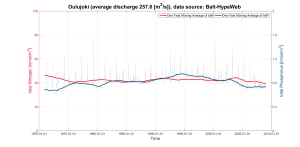
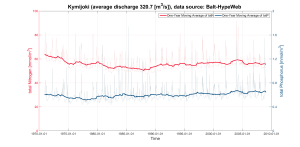
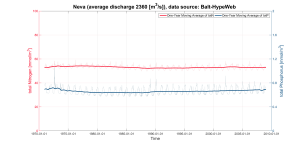
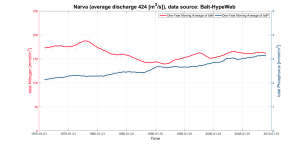
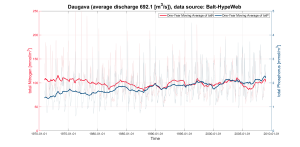
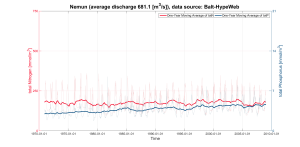
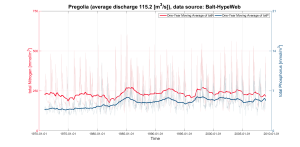
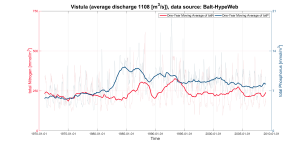
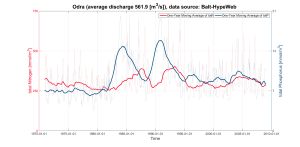
Weekly and averaged nitrogen and phosphorus concentrations. Details see River Report.
more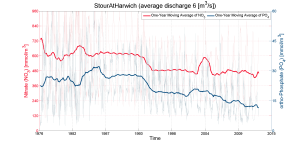
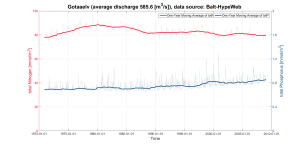
Weekly and averaged nitrogen and phosphorus concentrations. Details see River Report.
more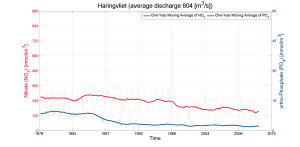
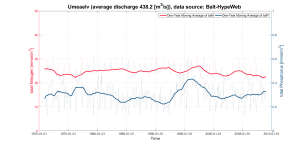
Weekly and averaged nitrogen and phosphorus concentrations. Details see River Report.
more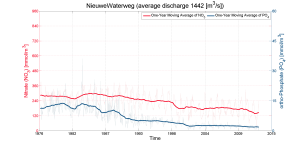
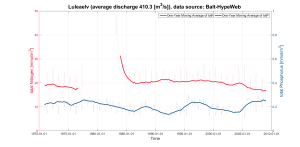
Weekly and averaged nitrogen and phosphorus concentrations. Details see River Report.
more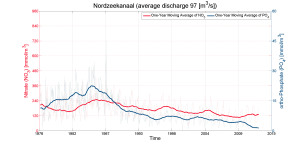
Weekly and averaged nitrogen and phosphorus concentrations. Details see River Report.
more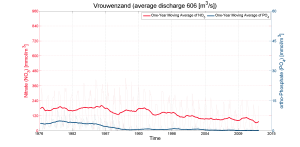
Weekly and averaged nitrogen and phosphorus concentrations. Details see River Report.
more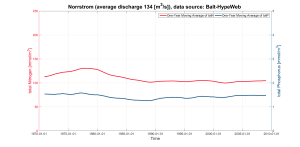
Weekly and averaged nitrogen and phosphorus concentrations. Details see River Report.
more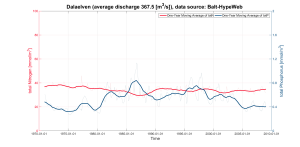
Weekly and averaged nitrogen and phosphorus concentrations. Details see River Report.
more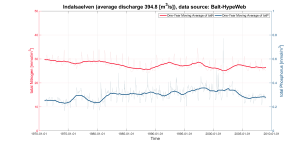
Weekly and averaged nitrogen and phosphorus concentrations. Details see River Report.
more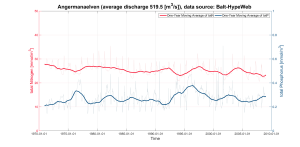
Weekly and averaged nitrogen and phosphorus concentrations. Details see River Report.
more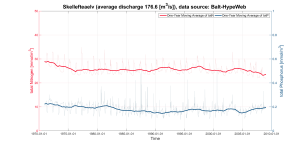
Weekly and averaged nitrogen and phosphorus concentrations. Details see River Report.
more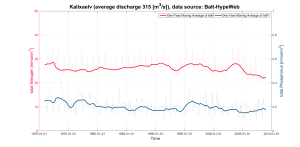
Weekly and averaged nitrogen and phosphorus concentrations. Details see River Report.
more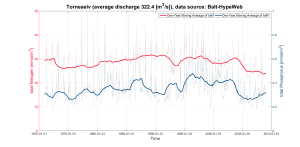
Weekly and averaged nitrogen and phosphorus concentrations. Details see River Report.
more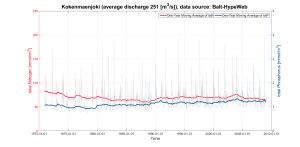
Weekly and averaged nitrogen and phosphorus concentrations. Details see River Report.
more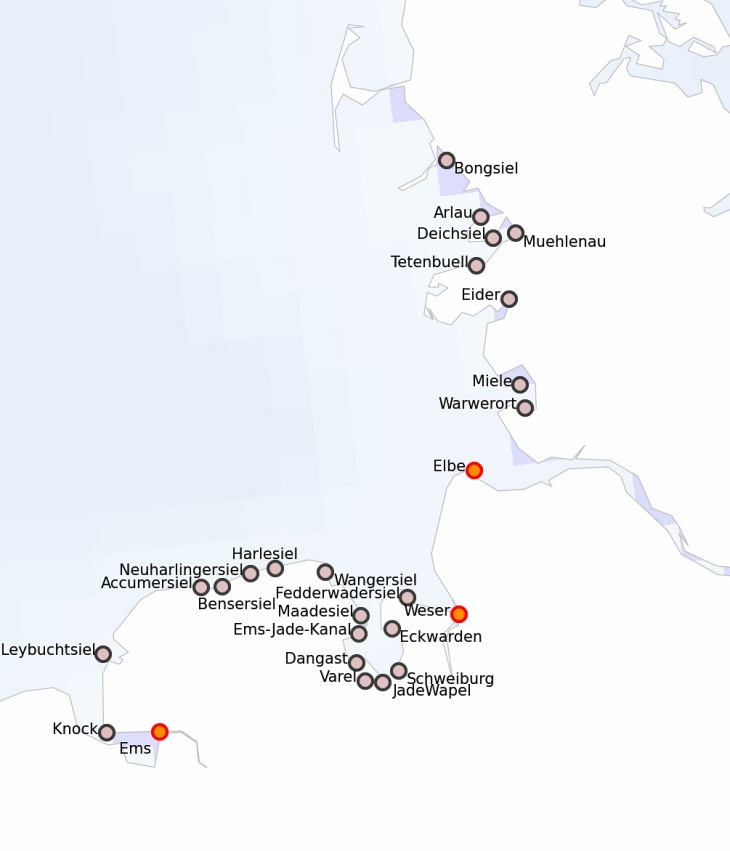
MOSSCO River data basis
Another essential aim of current work is the quantification and localization of nutrient retention processes as well as the changes of nutrient concentrations along river estuaries, so the area between measurement station and river mouth. Therefore time series of several measurement stations along the course of large rivers were integrated.
This quantification enables the assessment of actual nutrient inputs and is therefore of special importance for determining nutrient target values for the German North Sea within the Water Framework Directive (WRRL) and the Marine Strategy Framework Directive (MSRL).
Nutrient retention processes and additional nutrient tributaries entering in the ~80 km downstream are not taken into account in present evaluations which may result in inaccurate estimations about actual nutrient concentrations entering the sea.
Over- or underestimation of nutrient concentrations as model input may lead to misjudgment of nutrient boundary concentrations in the WRRL with consequences for the management of water catchment areas. To enable a specific evaluation, riverine inputs of numerous small German rivers were documented and analyzed.
MOSSCO River data basis – Riverine Nutrient inputs / Focus: Large rivers entering the North Sea (9,7 MB)
| Rivers | Discharge (m^3/s) | Time Series |
| German Rivers | ||
| Elbe | 716,2 | 1977 - 2012 |
| Ems | 83,0 | 1977 - 2012 |
| Weser | 327,3 | 1977 - 2012 |
| Dutch Rivers | ||
| Vrouwenzand | 569,0 | 1977 - 2012 |
| Schelde | 134,1 | 1977 - 2012 |
| Nordzeekanaal | 93,3 | 1977 - 2012 |
| Nieuwe Waterweg | 143,3 | 1977 - 2012 |
| Haringvliet | 746,5 | 1977 - 2012 |
| Great Britain Rivers | ||
| Chelmer | 4,3 | 1940 - 2016 |
| Colne | 2,3 | 1940 - 2016 |
| Gipping | 5,2 | 1940 - 2016 |
| Great Stour | 8,5 | 1940 - 2016 |
| Medway | 24,3 | 1940 - 2016 |
| Stour at Harwich | 5,2 | 1940 - 2016 |
| Thames | 110,1 | 1940 - 2016 |
| Small German Rivers | ||
| Accumersiel | 3,3 | 1997 - 2008 |
| Arlau | 9,0 | 1993 - 2009 |
| Bensersiel | 1,4 | 1997 - 2008 |
| Bongsiel | 26,6 | 1993 - 2009 |
| Dangast | 8,6 | 1988 - 1999 |
| Darrigbuellkoog | 1,3 | 1993 - 2009 |
| Deichsiel | 0,8 | 1993 - 2009 |
| Eckwarden | 1,8 | 1988 - 1999 |
| Eider | 55,4 | 1993 - 2009 |
| Ems-Jade-Kanal | 2,1 | 1988 - 1999 |
| Fedderwardersiel | 1,2 | 1988 - 1999 |
| Harlesiel | 3,0 | 1997 - 2008 |
| Hooksiel | 0,5 | 1988 - 1999 |
| Jade Wapel | 5,7 | 1988 - 1999 |
| Knock | 12,9 | 1997 - 2008 |
| Leybuchtsiel | 11,5 | 1997 - 2008 |
| Maade Siel | 3,4 | 1988 - 1999 |
| Miele | 14,4 | 1993 - 2009 |
| Mühlenau | 1,8 | 1993 - 2009 |
| Neuharlingersiel | 2,3 | 1997 - 2008 |
| Norderstrom | 1,3 | 1993 - 2009 |
| Schweiburg | 0,6 | 1988 - 1999 |
| Tetenbuell | 1,1 | 1993 - 2009 |
| Treene | 23,4 | 1993 - 2009 |
| Varel | 1,9 | 1988 - 1999 |
| Wanger Siel | 5,9 | 1988 - 1999 |
| Warwerort | 2,6 | 1993 - 2009 |
| Rivers | Discharge (m^3/s) | Time Series |
| Skellefteälv | 50,5 | 1970 - 2000 |
| Luleälv | 140,5 | 1971 - 2000 |
| Kalixälv | 83,8 | 1972 - 2000 |
| Torneälv | 112,4 | 1973 - 2000 |
| Kemijoki | 155,4 | 1974 - 2000 |
| Oulujoki | 72,7 | 1975 - 2000 |
| Kokenmaenjoki | 68,7 | 1976 - 2000 |
| Kymijoki | 85,0 | 1977 - 2000 |
| Neva | 666,6 | 1978 - 2000 |
| Narva | 107,7 | 1979 - 2000 |
| Daugava | 184,7 | 1980 - 2000 |
| Nemun | 49,5 | 1981 - 2000 |
| Pregolia | 45,1 | 1982 - 2000 |
| Vistula | 308,8 | 1983 - 2000 |
| Odra | 151,3 | 1984 - 2000 |
| Gotaälv | 185,7 | 1985 - 2000 |
| Norrstrom (Mälaren) | 48,2 | 1986 - 2000 |
| Dalälven | 95,6 | 1987 - 2000 |
| Indalsalven | 126,0 | 1988 - 2000 |
| Angermanalven | 148,6 | 1989 - 2000 |
| Umeälv | 132,6 | 1990 - 2000 |

