COSYNA Products
Quality-controlled, science-based, near real-time environmental information derived from observations and model results can assist governmental and local authorities as well as other stakeholders to manage routine tasks, emergency situations and evaluate trends. An operational system in the heavily used North Sea may serve as a role model for many coastal areas worldwide.
One of the first COSYNA products is the pre-operational analysis system for current fields in the German Bight based on real-time HF radar data.
Flotsam in the North Sea. Measurements and computer models help us determine where flotsam drifts in the North Sea (ESKP contribution).
Surface Current Fields in the German Bight
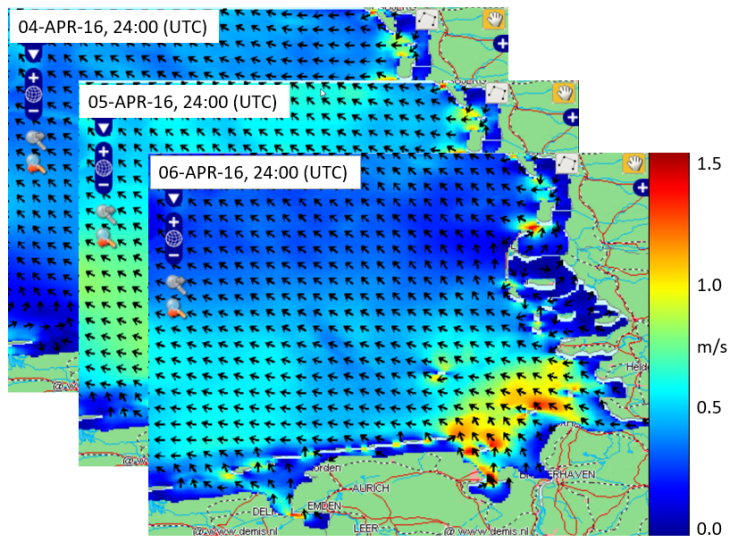
COSYNA Product: Currents in the German Bight, snapshots from 6 April 2016. -image: data from COSYNA data portal, Christiane Eschenbach / Hereon-
Surface current data from three high-frequency (HF) radar stations at Wangerooge, Büsum, and Sylt is continuously measured and transmitted in "real time" to the Helmholtz-Zentrum Hereon. After automated quality control, current vectors are calculated. Every hour, these data are linked to and assimilated into a 3D hydrodynamic model (General Estuarine Transport Model, GETM). Due to this data assimilation, the model results are closer to reality thus reducing forecast errors. In particular, the dominant (M2-) tidal signal is well represented.
The deviation from the measured HF radar current data is typically about 0.1 m/s, with large spatial variantions. Time series of current maps are publicly available for download from the COSYNA data portal. They can be utilized, for instance, for ship traffic safety, for the spreading of pollutants, or for rescue operations.
Waves
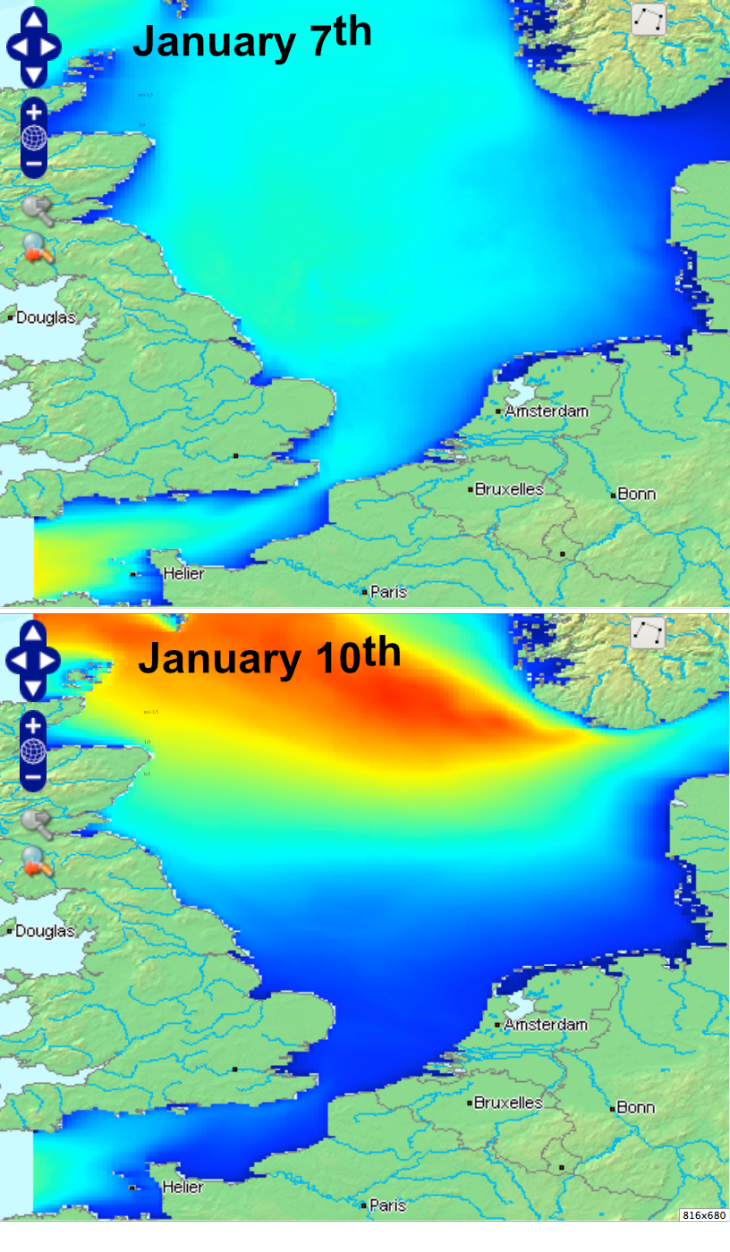
COSYNA Product: Waves, snapshots (forecasts) from 7 January and 10 January 2018. -image: data from COSYNA data portal / Hereon-
The pre-operational COSYNA wave forecast model system runs twice a day at 0 and 12 UTC and provides a 24 hour forecast on the regional scale for the North Sea and on the local scale for the German Bight. With boundary information from the regional wave model EWAM of the German Weather Service (DWD a number of wave parameters such as significant wave height, period, and total wave direction are calculated. Wave rider buoys serve for validation of the model outputs.
Temperature
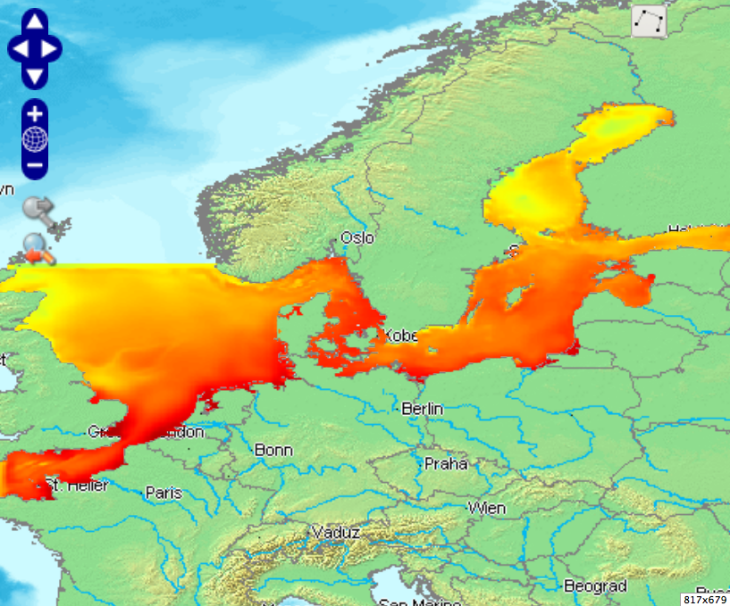
COSYNA product: Temperature results from a model, assimilated by remote sensing (OSTIA data set) for July 2017. -image: data from COSYNA data portal / Hereon-
Sea surface temperatures (SST) from satellites (Operational Sea Surface Temperature and Sea Ice Analysis – OSTIA) and FerryBoxes are assimilated into a North and Baltic Sea version of the three-dimensional circulation model GETM (General Estuarine Transport Model). The output is validated against independent data sets (for instance, the MARNET Deutsche Bucht station).
Chlorophyll
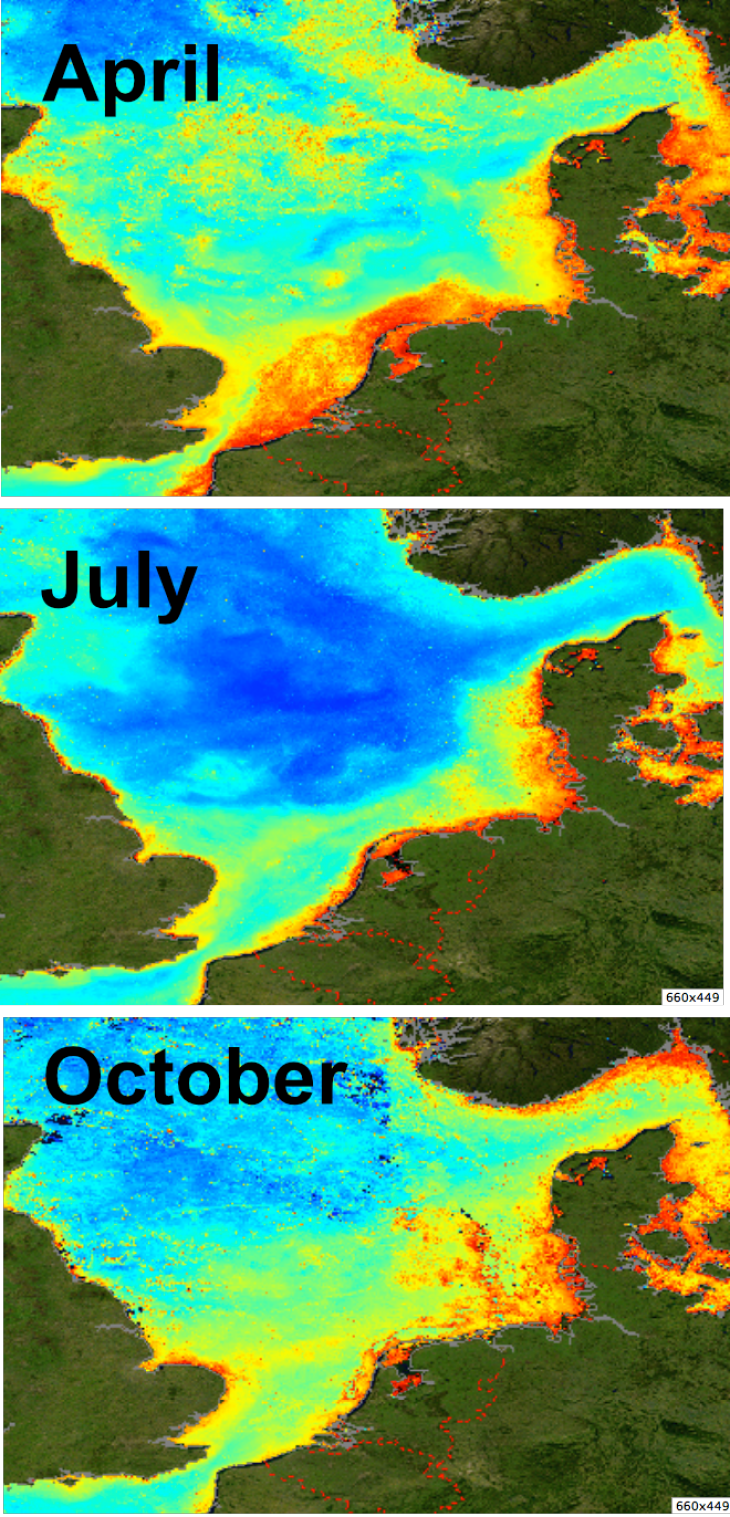
COSYNA product: Monthly mean chlorophyll concentrations (2017). After the first algal bloom in April chlorophyll concentrations decrease in Julydue to lack of nutrients. In October the concentrations increase again (fall bloom). -image: data from COSYNA data portal / Hereon-
Monthly means and maxima are derived from the daily fields to obtain an improved understanding of chlorophyll dynamics and to reduce the effect of cloud coverage on data. The images show the monthly maximum concentrations of chlorophyll in 2017. They were created by combining many daily scenes for each month. Optical remote sensing is ideal for obtaining spatial information over large areas for almost every day. The lack of information in deeper water levels and under clouds requires additional information from in situ measurements in combination with numerical models to interpolate missing data. Additional in situ data from measurement campaigns and stationary observing systems are taken to validate and improve satellite-derived data.

-image: Hereon-
One of the main characteristics of COSYNA is the development of pre-operational (i.e., routine provision of) ‘products’ that improve present routinely applied observational and modelling techniques. These products comprise hourly updated maps, model results, and 6 hour-forecasts of ocean currents, salinity, temperature, and waves. Future products will include wind fields, ship detection, and biogeochemical parameters. A COSYNA focus is on information derived from an optimized synthesis of observations and model data (see COSYNA product “current”).
The COSYNA products, data and metadata, are disseminated over the internet for further use by different end-users. COSYNA cooperates with government agencies, which, at some stage of the product development, could convert the pre-operational to operational products.