
Methods
The following instruments are available:
• HEMS – High-Energy Materials Science Beamline (P07):
for the study of residual stress, textures, phases and nano-structures
Contact: Dr. Norbert Schell
• High-Energy Materials Science Beamline with white beam (P61A, since 2021):
for spatially resolved studies of, e.g., of near-surface residual stresses and phases
Contact: Dr. Guilherme Abreu Faria
• RÖDI – Lab-X-ray diffractometer:
for the study of residual stress, textures and phases at the surface
Contact: Dr. Dieter Lott
In the following the most important methods are described.
Note that we are using high photon energies (50 … 150 keV) for penetration deep into material.
• Diffraction - P07 - phase analysis
For the quantitative determination of phase contents of a material.
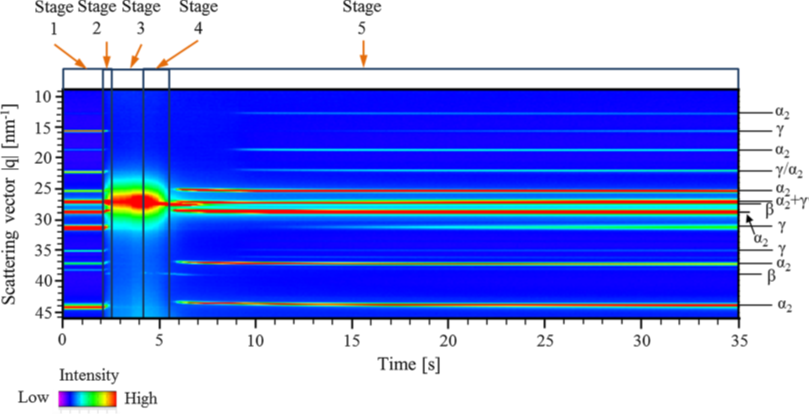
The example is about the development of laser welding as a joining technique for TiAl alloys. The image shows a stacked diffractogram plot during an in-situ laser welding experiment. Melting (stage 2), solidification (stage 4) and phase transformations (stage 5) in a TiAl alloy could be observed with a time resolution of 100 ms.
J. Liu et al., Met. Mat. Trans. A 47 (2016) 5761–5770, https://doi.org/10.1007/s11661-016-3726-x
• Diffraction - P07 - residual stress analysis
For the determination of residual stresses in the interior of materials and components. Conical slits are available for spatial resolution along the beam.
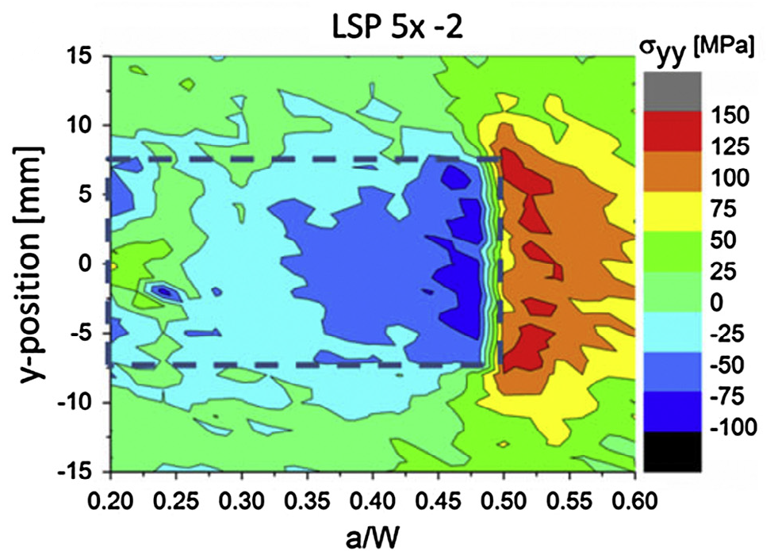
The example is about laser shock peening (LSP) of Al alloys. LSP is a surface treatment that can improve fatigue properties. The picture shows the distribution of residual stress in a CT sample with a laser shock peening treatment (area marked with dashed lines).
N. Kashaev et al., Intern. J. Fatigue 98 (2017) 223–233, http://doi.org/10.1016/j.ijfatigue.2017.01.042.
• Diffraction – texture analysis
For the determination of the crystallographic textures of the phases present in a material.
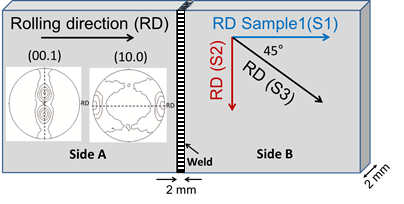
The crystallographic texture of a material can have a strong influence on the anisotropy of mechanical properties. It also affects residual the stress distribution which in turn influences fatigue properties of welds. This influence was studied in laser beam welded Ti alloy sheets. The picture shows how samples with different orientations of the rolling direction with respect to the welding direction were selected.
E. Maawad et al., Materials & Design 101 (2016) 137–145; https://doi.org/10.1016/j.matdes.2016.03.148.
• Diffraction – energy-dispersive!
For the determination of phase content, residual stresses and textures with position and time resolution within a fixed gauge volume. (Since 2021.)
Thermal history during Wire Arc Additive Manufacturing (WAAM) is complex, with a singular region being heated and cooled repeatedly until the process is complete. This temperature evolution leads to formation of stresses along the part height, which influence shape tolerance, mechanical properties, etc. In this example, the effect of part height on final stresses was investigated, leading to the observation that a stress gradient is present at the bottom and top of the wall, with similar dimensions regardless of part height.

a) 2000 series Al alloy wall produced with Wire Arc Additive Manufacturing. The dashed line indicates the region where the curves were measured, dimensions in cm. b) Stress distribution measured. (Figure adapted from original publication.)
T. Klein, P. Spoerk-Erdely, C. Schneider-Broeskamp et al., Metall Mater Trans A 55, 736–744 (2024), http://dx.doi.org/10.1007/s11661-023-07279-3
• Small-angle X-ray scattering (SAXS)
For the analysis of nano structures like e.g. precipitates.
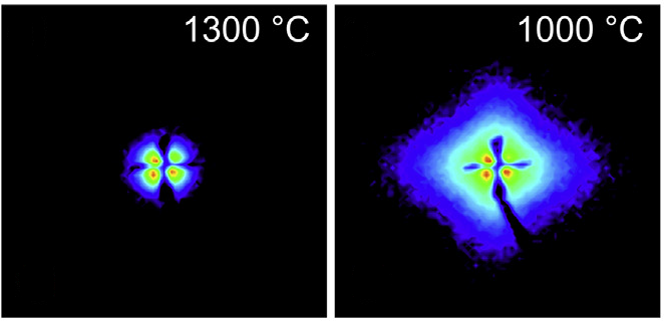
Additive manufacturing of Ni-based superalloys opens up new possibilities, but also comes with processing problems that require a deep understanding of the formation and dissolution of g‘ precipitates. SAXS enables the determination of size distributions and volume fractions of precipitates in the size range 1...100 nm with high sensitivity. The picture shows the SAXS signal at 1300°C without, and at 1000 °C with hardening precipitates. The measurement was carried out at P07 with a time resolution of 1 s during an in-situ SLM experiment.
B. Wahlmann et al., Acta Mater. 180 (2021) 84–96, https://doi.org/10.1002/adem.202100112